


RDEL #98: What Diff Authoring Time (DAT) reveals about developer experience
Three internal case studies at Meta reveal how DAT captured meaningful changes in developer efficiency through improvement in tools, UIs, and shared components.

Welcome back to Research-Driven Engineering Leadership. Each week, we pose an interesting topic in engineering leadership, and apply the latest research in the field to drive to an answer.
PR cycle time and deployment frequency tell us how quickly code moves through a system—but what about the time spent crafting the change in the first place? For many developers, authoring code is the most cognitively demanding and least visible part of the process. This week we ask: How can engineering leaders use Diff Authoring Time (DAT) to better understand and improve the developer experience?
The context
Engineering teams have invested heavily in streamlining delivery: from automating CI pipelines to tracking pull request cycle times. But these metrics all begin after code is written. For developers, the authoring phase—the time spent understanding context, writing new logic, and debugging locally—can be where the real complexity lies. Challenges in the authoring phase have real consequences for developer productivity.
Without understanding the friction in the code authorship phase, teams risk misidentifying bottlenecks or undervaluing the cognitive load certain tasks place on their developers. Introducing a lightweight, privacy-respecting way to measure code authoring time offers a more complete view of productivity and developer experience—one that starts before the PR is opened.
The research
To explore how Diff Authoring Time (DAT) can be used to understand developer productivity, researchers at Meta conducted three case studies across different internal projects. DAT captures the time between a developer's first edit and when a pull request (PR) is created, using activity logs to infer start and end times without developer self-reporting.

Each case applied DAT to a specific productivity intervention to determine if the change led to faster, more efficient diff creation. Those studies included:
Case 1 - Using Mock types in a testing library:
Introducing a new mock type in a testing library led to a 14% reduction in median DAT, suggesting the new tool improved developer efficiency. This was evident in the shift of the DAT distribution after rollout.
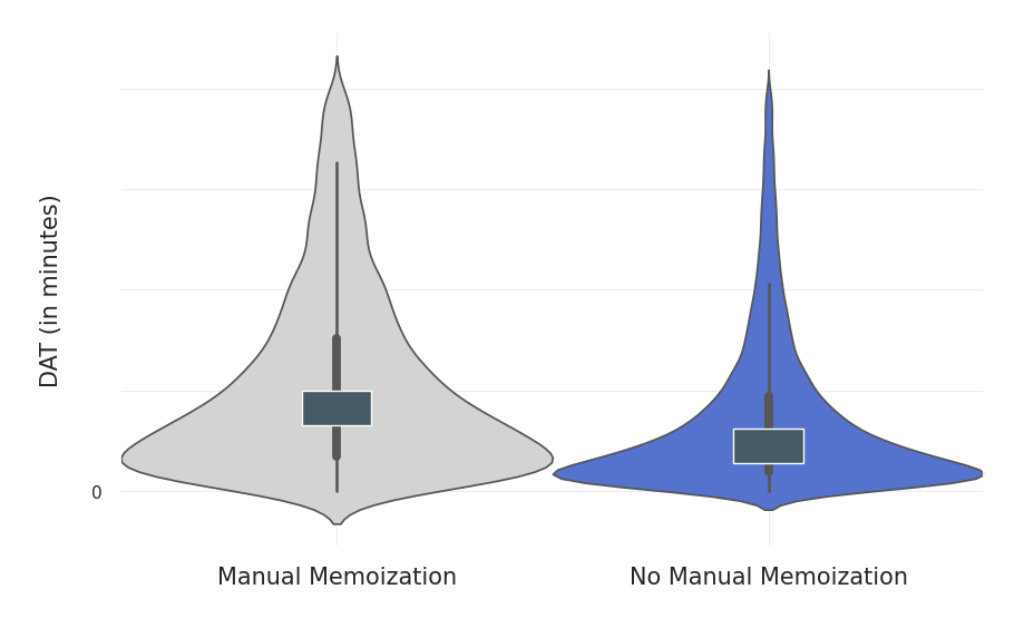
Case 2 - React memoization:
Enabling automatic memoization in the React compiler led to a 33% median reduction in DAT for diffs using the change. This confirmed the intervention's effectiveness without requiring subjective feedback.
Case 3 - Code sharing:
Teams using shared internal code libraries experienced over 50% lower median DAT than those that didn't. This provided quantifiable evidence of the benefits of platform investment.
Researchers concluded that DAT is broadly applicable. The metric was effective across different domains (testing, UI tooling, shared libraries), suggesting it is a flexible and general-purpose measure of engineering effort.
The application
Diff Authoring Time provides a new way for engineering leaders to evaluate changes aimed at improving the developer experience. It helps engineering leaders see the full lifecycle of a code change, from first keystroke to deployment, and identify where developers struggle before the review even begins. By incorporating DAT into how you monitor and improve developer experience, you can better prioritize tooling, simplify workflows, and reduce friction where it matters most.
Here are a few practical ways to apply the research:
Use DAT for platform evaluation: If you're rolling out a new internal tool, shared library, or API, track whether it reduces the time engineers spend authoring similar changes.
Segment by team or change type: Use DAT distributions to identify outliers or teams with unusually high authoring time, which may reveal opportunities for platform or onboarding improvements.
Combine with qualitative insights: DAT tells you how long engineers take to author code—but not why. Pair it with survey data or interviews to uncover the friction behind the metric.
—
Happy Research Tuesday!
Lizzie