RDEL #68: What are the latest benchmarks for the "DORA four" key metrics? (2024 DORA Report)
This week, in our final review of the 2024 DORA report, we analyzes changes to the four key metrics made famous by the DORA group.
Welcome back to Research-Driven Engineering Leadership. Each week, we pose an interesting topic in engineering leadership and apply the latest research in the field to drive to an answer.
It wouldn’t be a full review without reviewing the four metrics that made the DORA report famous. In the last of our three-part review of the 2024 DORA report, we ask: what are the latest benchmarks of the “DORA four” key benchmarks?
The context
The DevOps Research and Assessment (DORA) group’s annual report marks a decade of research into the practices that drive high-performing software engineering teams. This year’s report surveyed more than 39,000 technical professionals, providing a robust data set on key performance metrics like software delivery, productivity, and team dynamics. We previously covered the report’s top findings on how AI has impacted engineering performance and how user-centricity impacts product performance.
Perhaps one of the most famous byproducts of the DORA team are the “four core metrics”, which have been used to measure the throughput and stability of software changes. As a recap, these are the four metrics:
Change lead time: the time it takes for a code commit to be successfully deployed to production
Deployment frequency: how often application changes are deployed to production
Change failure rate: the percentage of deployments that cause failures in production, requiring hotfixes or rollbacks
Mean time to recovery (aka failed deployment recovery time): the time it takes to recover from a failed deployment.
The research
Researchers performed a cluster analysis on responses about the software delivery performance of the primary application they work on. Each year, four clusters of responses emerge to represent the different performance levels of engineering organizations. Below are 2024’s updated responses.
Interestingly, this data shows that “high performing” teams had a higher change failure rate than “medium performing” teams. This is because researchers determined that for performance, frequent deployments were more important than fewer failures. In their words:
“…The best teams are those that achieve elite improvement, not necessarily elite performance”.
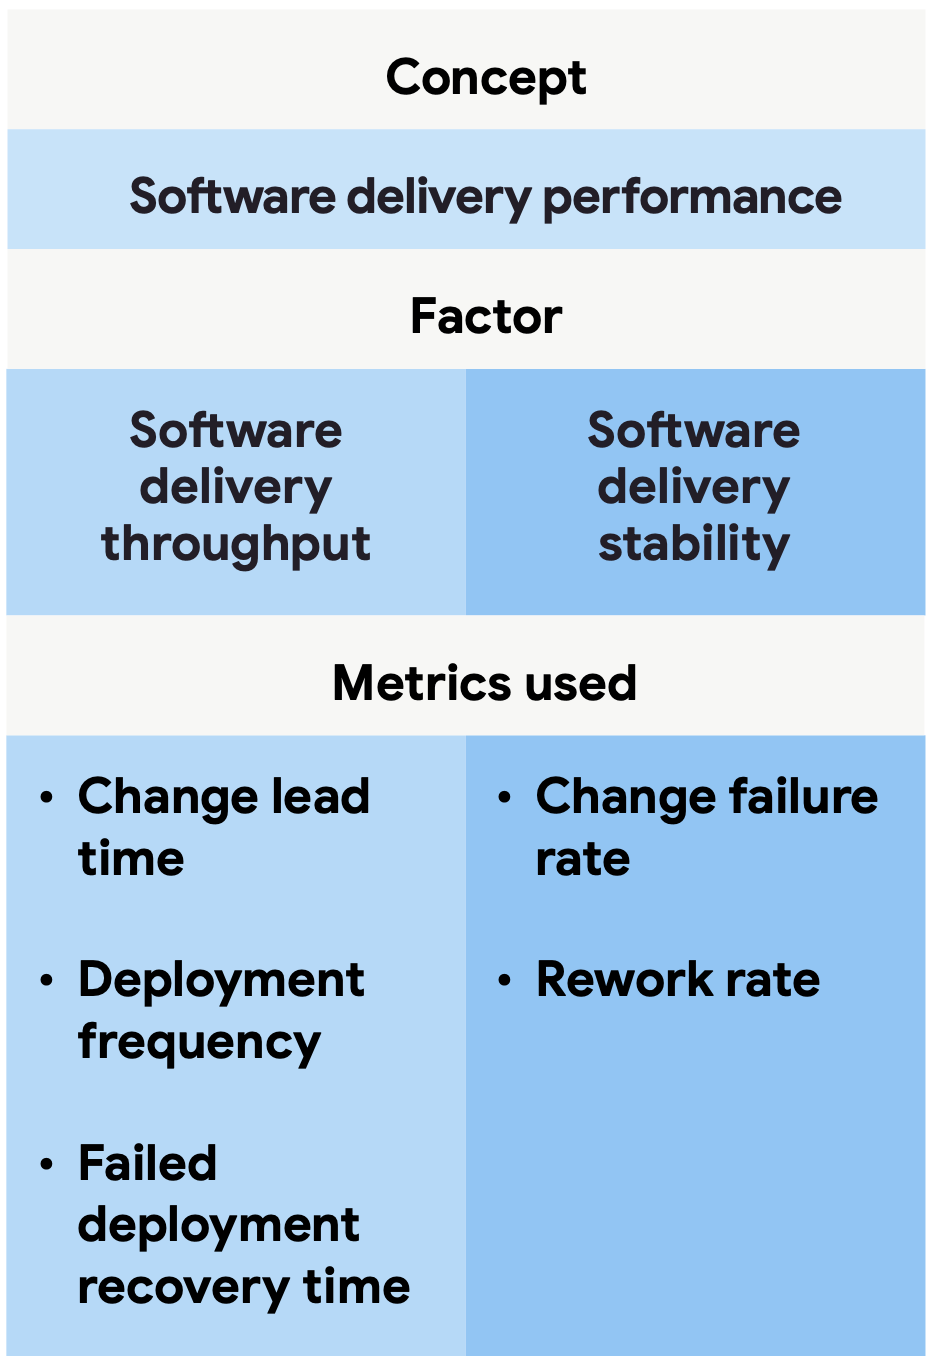
Finally, this year for the first time researchers were able to create a more complete model of how these key metrics roll up into one concept of software delivery performance. The two key factors are software delivery throughput (which measures the speed of making updates of any kind), and software delivery stability (which measures the likelihood deployments unintentionally lead to immediate, additional work).

The application
Each year, the DORA group provides a great set of benchmarks for understanding delivery performance. This year, they also did a fantastic job of highlighting that the goal is elite improvement, not necessarily elite performance.
For engineering leaders, here are the steps you can take to use the software delivery performance metrics. Using these steps, teams can create a continuous feedback cycle of improving and measuring their systems, which will lead to improved performance across the board.
Start by determining the primary application you want to improve. Measure your baseline metrics for the application so you can compare once your efforts have been achieved.
Identify and agree on a plan for improving. This plan should have the buy-in from any cross-functional areas that are responsible for this application or service.
Get started! Dedicate capacity to the improvement and take note of what you learn as you go.
Evaluate the data. Reflect on whether the changes you made had the intended outcome, and what was learned.
And then…repeat! Because it’s about continuous improvement.
(Note: these steps are fantastic for measuring and improving the health of an application or service. When you want to look at improving the productivity of an engineering team, the SPACE framework is a more comprehensive place to look).
—
Thank you for enjoying our three-part series on the 2024 DORA report. It’s been a joy to review and recap the findings. See you next week!
Lizzie


