


RDEL #65: How did Google develop its developer experience program?
This week we cover how Google built its developer experience initiatives, and what lessons they learned from 6.5 years of iterations.

Welcome back to Research-Driven Engineering Leadership. Each week, we pose an interesting topic in engineering leadership and apply the latest research in the field to drive to an answer.
This week, we’re dissecting how researchers built Google’s developer experience program and lessons they learned over 6.5 years on how developer experience programs improve productivity.
Also: Our team just launched a quick, 5-question survey on technical and social drivers of productivity on engineering teams. If you want to contribute to our dataset and get a snapshot from hundreds of engineering leaders, please fill this out before October 31st. Thanks!
The context
Google initiated its Engineering Satisfaction Survey, or EngSat, in 2018 to understand the needs of their software developers at scale, complementing existing logs data. The aim was to measure experiences specific to developers, such as technical debt, flow, and code quality, which are difficult to capture through logs alone. Google tailored EngSat to focus on developer-specific tasks and internal tools, differentiating it from other employee surveys.
By combining logs-based data and developer feedback, the program provided a comprehensive view of developer satisfaction and productivity. Over time, this longitudinal approach has enabled Google to track changes, validate metrics, and drive improvements in areas like technical debt and developer workflows.
The research
Over the last 6.5 years, researchers at Google have used EngSat to uncover and track various changes in the developer experience of engineers.
Key aspects:
Researchers identified three key aspects of the program:
Adequate attention: At Google, they rotate one UX researcher and one engineer to own the program each quarter. The rotation ensures that institutional knowledge does not stay within one person, and gives fresh eyes to the program so they can ensure it maintain a high bar.
An established process: As the researchers put it:
“We automate things where we are able, we provide templates and examples where we can’t automate, and (regardless) we write everything down”.
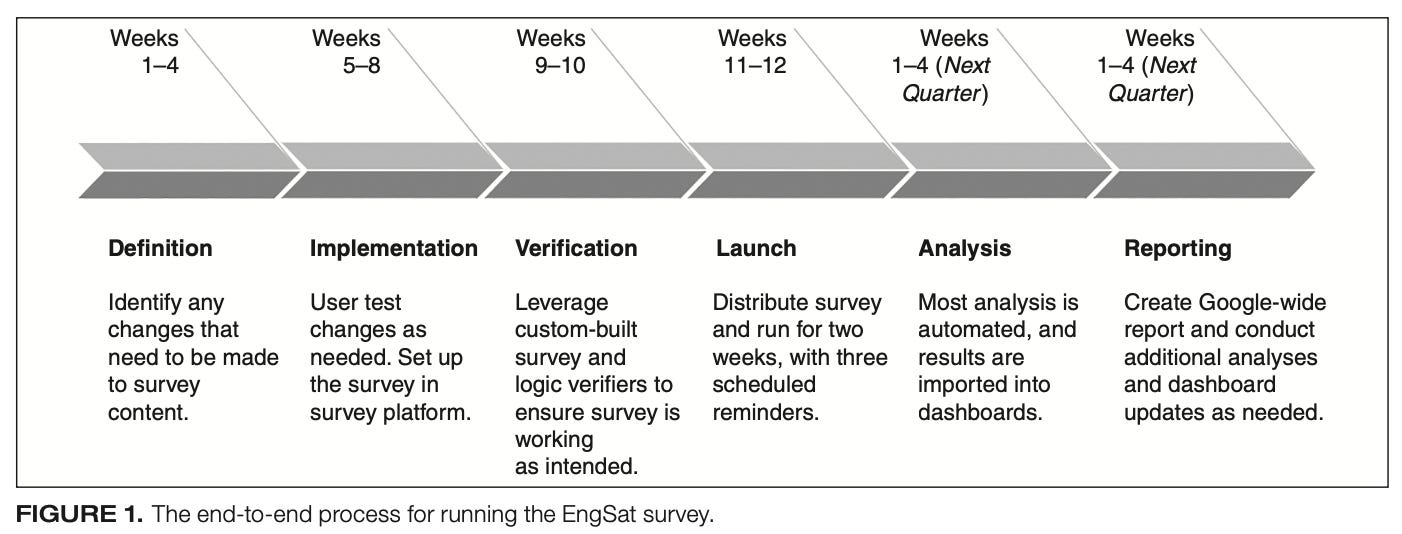
Infrastructure and automation: the team analyzes the data using an internal tool that aggregates the data into into clear results that can be used for dashboards and reports. In order to do this, they use a single survey format and a series of scripts that allow them to analyze the data consistently.
How it’s used:
The team uses the data in a few important ways to drive overall improvements in productivity. Some examples include:
Tracking major changes: The team established a baseline and use that to assess how org productivity changes over time. For example, Google already had EngSat in place when COVID started, which allowed them to better understand how the pandemic impacted people’s working experiences. The team could discover and implement improvements faster because they already had a baseline of how the team worked.
Validating log-based metrics: the strength of their analysis has improved with a mix of quantitative and qualitative data. The combination of the two means system-based trends can be better understood with data from engineers that cannot be captured in other ways, and vice versa, developer sentiment can be further validated through their log-based behaviors.
Taking long-term initiatives: EngSat allowed Google to tackle multiyear initiatives that required the right visibility, motivation, and data to execute, like reducing technical debt. For example, they identified technical debt as a top hindrance to productivity in 2019, and since then have prioritized numerous investments to improve. Those investments have paid off, as they’ve seen through consistent score changes in their EngSat and log data.
Biggest challenges:
Researchers have faced two big challenges over the years that they’ve tackled over time:
Survey length. It has always been tempting to add more survey questions, but theres a tension between adding new questions, keeping consistent questions, and keeping survey length short enough. To address this, researchers identified a few “evergreen” questions that stay consistent in each survey alongside a questions that are more specific to an existing initiative. They regularly review questions for any duplicative or obsolete ones.
Survey participation. To keep high response rates, researchers split the organization into three groups and sequentially survey one group each quarter. They also make sure each question is actionable and scalable, meaning engineers could see changes as a result of their responses.
The application
Theres much to take away from how Google structured and iterated on their EngSat program, but for our application we’ll focus on the top things engineering leaders should keep in mind when adopting a developer experience program:
Build in accountability. In larger organizations, this can be owned by DevProd or Platform teams (like Google). In smaller organizations, this is usually owned by engineering leadership more broadly and managed on a team-by-team basis. Accountability means there is ownership of the goals, data and much more importantly, the actions to improve.
Maintaining accountability and building buy-in from the team will keep survey participation high, as well. When the team’s perspectives directly contribute to actions that improve their experience, the team forms a natural feedback loop
Create a complete picture. The Google team combined EngSat data with logs to understand how actions and sentiments come together. Doing so mitigates over-indexing too much on activity, as well as sampling bias.
Note: for a framework on how to combine qualitative and quantitative data, we recommend the SPACE framework.
Establish a baseline. The best and most accurate form of comparison is prior self to current self. Establishing a baseline on the team means you can understand how important changes impact the team, and eventually move from reaction to proaction.
Be transparent. Metrics programs often fail due to lack of transparency, which can break trust with the team. As part of building accountability, share both the goals and the progress with the team. As the researchers share,
“The quality of your insights depends on the feedback provided by developers, so make it clear why they should spend their time on it".
—
Thanks for reading, and special thanks to the Google research team for sharing their experience with building a developer experience program. Don’t forget to briefly share your experience on technical and social drivers on teams in this 5-question survey. Til next week!
Lizzie