
RDEL #42: How does developer satisfaction lead to improved productivity?
This week, we break down the factors that contribute to developer satisfaction and look at research that correlates those factors to changes in productivity.

Welcome back to Research-Driven Engineering Leadership. Each week, we pose an interesting topic in engineering leadership, and apply the latest research in the field to drive to an answer.
Prior research has demonstrated a connection between happy engineers and improved productivity. This week, we dig into the actual sociotechnical factors and ask: how does developer satisfaction lead to improved productivity?
The context
The latest research in developer productivity has shown that satisfaction is a key driver of improved outcomes for software engineers. The SPACE framework, authored by the Microsoft Research team, is a widely-accepted framework to measure developer productivity and uses satisfaction as one of the five categories to measure.
A challenge in using satisfaction as a driver of developer productivity is that the concept of satisfaction is somewhat nebulous, which makes it difficult to understand what about satisfaction contributes to increased productivity. To address this, researchers constructed a framework for “developer thriving”. This framework builds on the known connection between satisfaction and productivity to answer what drives satisfaction in the first place. From here, we can dive into how satisfaction leads to productivity.
The research
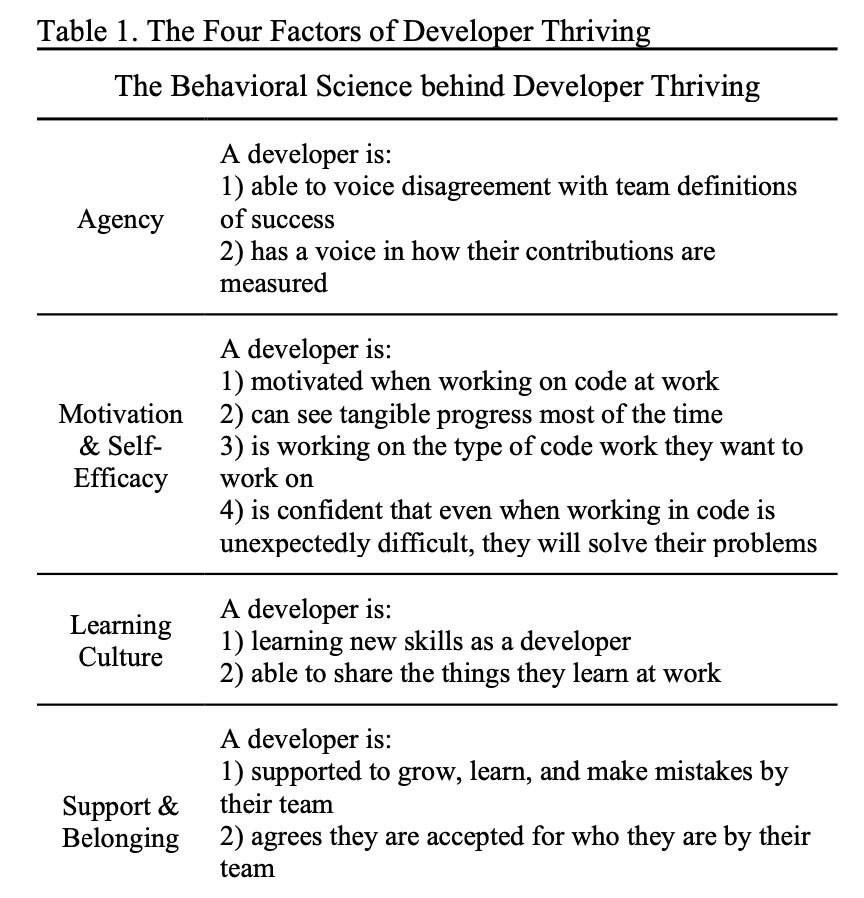
To investigate how satisfaction (or developer thriving) impacts developer productivity, researchers conducted a large-scale survey among 1282 software developers from various industries. They assessed the developers' perceptions of developer thriving (agency, motivation & self-efficacy, learning culture, and support & belonging), alongside their self-reported productivity. The data collected was then analyzed using statistical models to identify and quantify the relationships between these sociocognitive factors and productivity outcomes.
Researchers found that:
Developers with high agency reported 34% higher productivity compared to those with less control.
Developers who felt competent and engaged with their work were 28% more productive than their less motivated peers.
Teams with a robust learning culture, where knowledge sharing and continuous professional development were encouraged, saw a 45% increase in productivity metrics compared to teams without such a culture.
A supportive environment that fostered a sense of belonging was associated with a 37% increase in productivity. This environment also positively impacted developers’ mental health and overall job satisfaction .
The researchers also saw that healthy metrics use (which are fair and representative to the team) was associated with increased visibility and value of work.

The application
This study makes it clear just how satisfaction leads to improved productivity, and also offers a more structured way of thinking on how to measure and improve the psychometric aspects of developer experience. Agency, motivation & self-efficacy, learning culture, and support & belonging are all highly and positively correlated with improved productivity. From this, the key takeaways for engineering leaders are:
Empowerment is key. Giving engineers more control and decision-making power over their work pays off in their productivity and overall job satisfaction.
Promote continuous learning. By encouraging ongoing learning and development (whether through formal learning opportunities or through team knowledge sharing practices), teams become more adaptable and better equipped to handle new challenges, leading to higher productivity.
Ensure engineers feel valued. When teammates understand that their contributions are important, pride in their work translates to higher-quality outcomes.
Most importantly, measure satisfaction in your metrics of productivity. You can use the developer thriving scale, for example, and include questions around agency, motivation and self-efficacy, learning, and belonging in your assessment of team productivity. Assessing these metrics alongside more traditional quantitative metrics (and aggregating data to the team level!) will create a clear picture of what drives productivity on the team, and where to resolve bottlenecks in the process.
—
Wishing you all a wonderful week,
Lizzie