
RDEL #151: How did Microsoft design their EngThrive developer productivity program?
An eight-week focus time initiative raised PR velocity 13%, equivalent to adding roughly 350 developers, without sacrificing quality or wellbeing.
Welcome back to Research-Driven Engineering Leadership. Each week, we pose an interesting topic in engineering leadership and apply the latest research in the field to drive to an answer.
Productivity dashboards have an uncomfortable habit of disagreeing with themselves: PR velocity is up while the team reports burnout, or satisfaction is high while delivery is slow. Frameworks like SPACE and DORA tell leaders what to think about, but not what to operate day to day. At Microsoft, researchers and leaders turned this challenge into a program that powers interventions for thousands of developers. This week we ask: how did Microsoft build EngThrive, their productivity measurement system?
The context
Measuring developer productivity runs into two classic traps: Goodhart’s law (when a measure becomes a target, it ceases to be a good measure) and the streetlight effect (measuring what is easy to instrument rather than what matters). Frameworks like SPACE, DevEx, and DORA established that productivity is multidimensional, but frameworks are principles, not operations, and most leaders still struggle to answer what to measure on Monday morning.
When organizations treat activity metrics as proxies for outcomes, they build systems that are precise but wrong, then act on them with conviction. A team at Microsoft set out to close that gap, and what they learned challenges some common assumptions, including the belief that gaming a metric is always bad.
The research
Researchers at Microsoft published a detailed account of EngThrive, the company’s internal productivity measurement system. The findings draw on years of telemetry and large-scale surveys across Microsoft’s engineering population, combined with case studies of interventions run in organizations of thousands of developers.
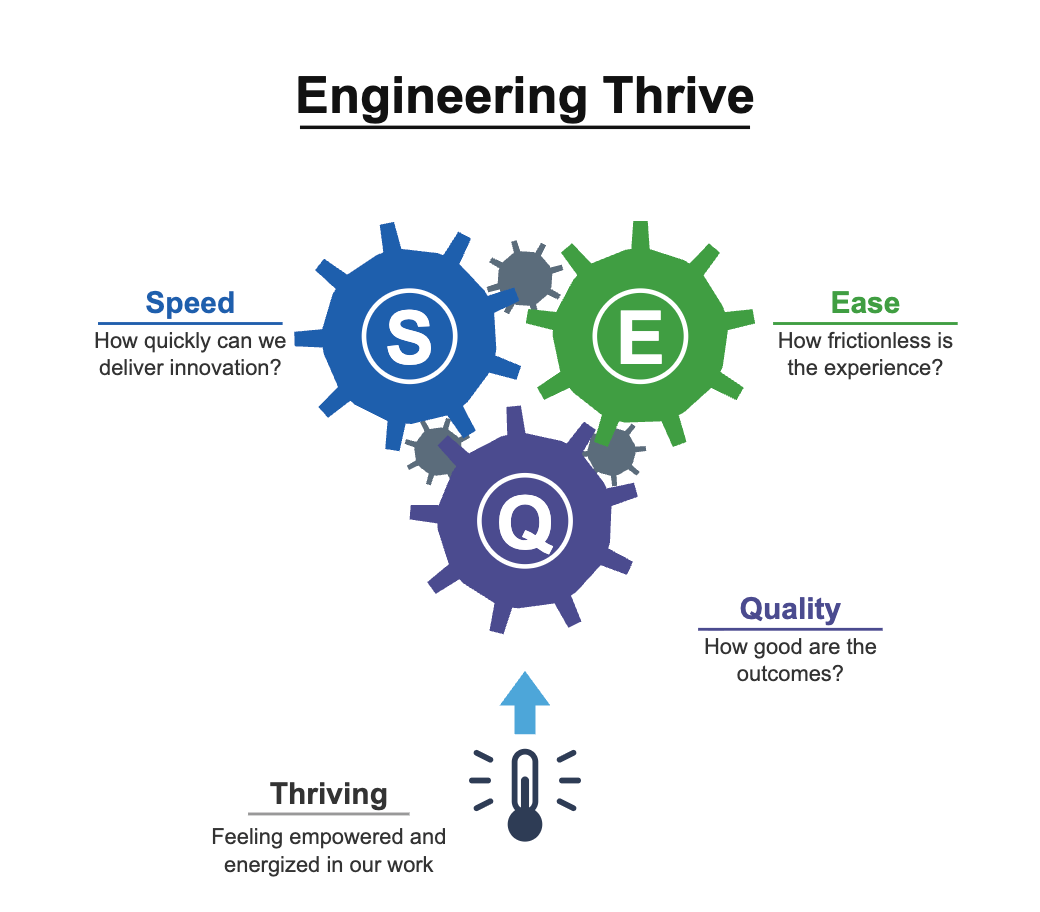
Here are some of their key principles and findings:
Single signals routinely point in opposite directions, and this is the norm, not the exception. During Microsoft’s first two months of pandemic remote work, PRs per developer rose more than 20% while 78% of developers reported burnout. As the authors put it, any one signal “would have told a confident and completely misleading story.”
The system rests on three outcome dimensions plus a guardrail. Speed (idea-to-customer time), ease (innovation time ratio), and quality (PRs per incident, incident mitigation time) form a triad where “a metric is considered improved only if it preserves or enhances the other two.” Thriving, measured through satisfaction and “bad developer days,” acts as a check that gains aren’t coming at the expense of the people doing the work.
More than half of all developer days qualified as “bad days.” When Microsoft computed its bad developer days composite (excessive context switching, build failures, insufficient focus time, incident toil), 52 percent of days crossed the threshold.
Developers with three or more bad days per week were three times more likely to quit and produced 20 percent less code.
A focused eight-week intervention moved every dimension at once. When one organization of thousands of developers targeted meeting load and focus time, focus time rose 2.1 hours/developer/week, bad days dropped 25%, and PR velocity rose 13%, equivalent to the output of roughly 350 additional developers. Notably, only half the improvement in bad days came from added focus time; teams used the reclaimed capacity to pay down technical debt.
Gaming a well-designed metric can produce genuine improvement. One organization deliberately “gamed” time-to-first-PR by assigning trivial first PRs to new hires, and those developers went on to produce 23% more PRs over their first 12 months. The act of gaming forced the right behaviors: environment setup, learning review conventions, and shipping something real.
The application
The core lesson of EngThrive is that measurement fails not from bad data but from incomplete interpretation: activity metrics tell you about motion, and only outcome metrics tell you about progress. This distinction is especially relevant right now: as AI inflates activity signals like PR velocity or token spend, outcome metrics such as idea-to-customer time and PRs per incident remain stable, making them the right yardstick for whether AI investments are actually paying off.
You don’t need Microsoft’s infrastructure to apply the model, but rather a set of outcome-oriented metrics that hold each other in tension. Here’s how to start:
Pick 2 or so metrics per dimension, and pair telemetry with a survey question. The authors are explicit that a speed metric from telemetry paired with a satisfaction question is more informative than five telemetry metrics alone.
Choose metrics where gaming is indistinguishable from improvement. Before adopting a metric, ask: if a team games this, do we still win? Time-to-first-PR passes the test; lines of code does not. If a metric can only be improved by doing the wrong thing, choose a different metric.
Measure the system, not the individuals. EngThrive deliberately has no individual-level dashboards, and its metrics are never used to rank engineers. Doing so is foundational to data quality, team trust, and driving the right outcomes. Managers are accountable for the environment they create, and the dashboards reflect that.
Wishing you a week of fewer bad developer days.
Happy Research Tuesday!
Lizzie