
RDEL #144: How well do public benchmarks predict AI coding agent performance in production?
A richer agent harness lifted solve rates more than swapping models, and added context files only helped when the underlying tooling was weak.
Welcome back to Research-Driven Engineering Leadership. Each week, we pose an interesting topic in engineering leadership and apply the latest research in the field to drive to an answer.
When engineering teams pick an AI coding agent to roll out, they often lean on public benchmarks like SWE-Bench to compare models. But those benchmarks are built from Python GitHub issues, while your developers are typing rough, context-laden requests into a chat window inside a giant private monorepo. This week we ask: how well do public benchmarks actually predict how AI coding agents will perform on production work?
The context
Public benchmarks have become the default way to compare AI coding agents. SWE-Bench, the most widely used, sources its tasks from real Python GitHub issues: well-written descriptions that human contributors crafted to communicate with other humans. They’re self-contained, symptom-focused, and tied to a handful of open-source repositories.
The reality of in-house development looks quite different. Engineers work inside large monorepos with proprietary build systems, ephemeral indexing services, and internal vocabulary. They type underspecified, conversational requests into AI assistants (e.g., “the power search filter is not working properly... you can check this file and make it working the same way”) and expect the agent to know what they mean. This mismatch raises a practical question for engineering leaders: are organizations making real deployment decisions on signals that don’t actually reflect their workloads?
The research
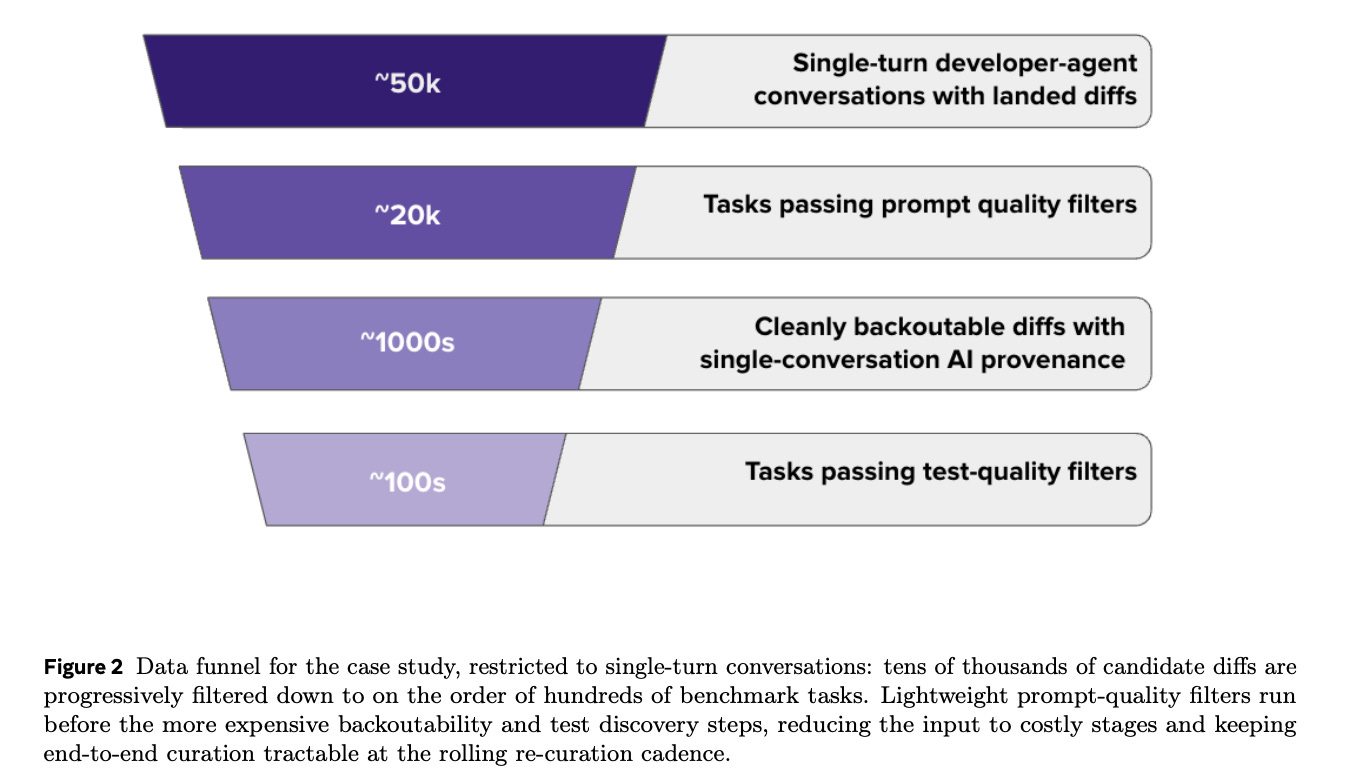
Researchers at Meta built REAP (Relevance and Execution-Audited Pipeline), an automated curation pipeline that constructs evaluation benchmarks directly from real developer-agent sessions in their monorepo. Using REAP, they curated Harvest, a 132-task benchmark pairing verbatim developer prompts with fail-to-pass tests, and used it to evaluate five frontier models (Claude Opus 4.6, Claude Sonnet 4.5, Claude Haiku 4.5, GPT-5.4, Gemini 3.1 Pro) across three runs each.
Production prompts look nothing like GitHub issues. A qualitative review of all 132 prompts found they “assume implicit enterprise context,” reference internal vocabulary and prior diffs by identifier, ask for pattern propagation across the codebase, and embed IDE-workflow actions. Most of these patterns are “structurally absent from benchmarks derived from GitHub issue bodies.”
Language distribution diverges sharply from public benchmarks. Harvest is dominated by Hack (47.7%), with Python at only 18.9%, plus C++, Kotlin, and others. SWE-Bench and SWE-Bench Verified are Python-only, so a Python-heavy leaderboard tells you very little about how a model will handle a polyglot codebase.

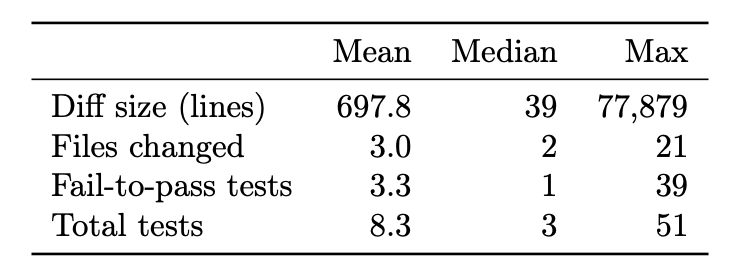
Per-task structural statistics for Harvest Frontier models clustered, but with a meaningful spread. Solve rates ranged from 42.9% (Claude Haiku 4.5) to 58.2% (Claude Opus 4.6), with GPT-5.4 and Gemini 3.1 Pro tied at 57.1%. The 15-point gap between top and bottom is large enough to drive real deployment decisions on cost and quality.
The task-type mix shifted toward refactoring and feature work. In production, refactoring and feature requests led the distribution, with bug fixes representing a smaller share. This is a meaningful divergence from issue-derived benchmarks where, as the authors note, “bug-fix tasks dominate.”
Tooling can matter as much as the model. A richer harness (with roughly 3x the tools of a simpler baseline) consistently outperformed the basic one. Adding developer-authored Context Files lifted the weaker harness by 6.4pp, but on the stronger harness the same files added “context noise without new information” and slightly hurt performance.
The application
Public benchmarks are useful for tracking gross capability trends, but they likely understate how much your specific production context shapes results. The mix of languages, prompt style, codebase scale, and tooling around the model can move solve rates by more than the gap between frontier models. Before locking in a model choice based on a public scoreboard, ask whether the benchmark resembles your reality.
Build a small production-derived eval before locking in a model choice. Even a curated set of a few dozen representative tasks from your own developer-agent sessions will tell you more than a public leaderboard. Meta’s 132-task benchmark surfaced clear capability tiers, so you don’t need thousands of tasks to make a defensible decision.
Treat the agent harness as a first-class variable, not a wrapper. The same model can show very different solve rates depending on which tools it has access to and how it uses them. Audit your agent’s tool usage patterns (Meta found GPT-5.4 spent 56% of calls in shell, while Gemini favored search at 37%) and invest in strong code navigation and validation tools before piling on more context.
Re-evaluate context files after every tooling change. Curated context (style guides, conventions, internal patterns) is a clear win when your agent’s tooling is thin, but the same files can become noise once tooling improves. Build a habit of pruning context documents after each harness upgrade rather than letting them accumulate.
Thanks for reading, and may your benchmarks resemble your reality this week.
Happy Research Tuesday!
Lizzie
The 16-point gap between Claude Haiku's 42.9% and Opus's 58.2% on Meta's Harvest benchmark matters less than your finding that a richer tooling harness outperformed model swaps. Builders have been asking 'which model?' when the actual variable is 'which harness?' The 47.7% Hack, 18.9% Python distribution in production also quietly rebukes the Python-centric research community that designed the benchmarks everyone uses for procurement decisions. What would need to change about benchmark design for enterprise teams to actually revise model contracts based on production-derived evals, rather than just noting the paper and moving on? Covering this from the builder side at theaifounder.substack.com.
The funnel chart is the part that should keep eng leads up at night. 50K to 100s is a 500x gap between what runs and what’s actually production-ready. Public benchmarks select for the top of that funnel because the bottom is expensive to measure. Most procurement decisions live in the gap.