
RDEL #115: What are the 2025 benchmarks for the key DORA metrics?
Only 16% of teams deploy on-demand while 24% deploy less than monthly, revealing a stark divide in delivery maturity.
Welcome back to Research-Driven Engineering Leadership. Each week, we pose an interesting topic in engineering leadership and apply the latest research in the field to drive to an answer.
The DORA metrics have long provided a framework for measuring software delivery performance, but the benchmarks evolve as practices mature and new technologies emerge. This week we ask: What are the 2025 benchmarks for the key DORA metrics?
The context
For over a decade, DORA’s research has tracked four key metrics: deployment frequency (how often code reaches production), lead time for changes (how long from commit to deployment), change failure rate (percentage of deployments requiring immediate remediation), and failed deployment recovery time (how quickly teams restore service after a failure). Together, these metrics capture both throughput and stability.
However, raw numbers without context provide limited value. A team deploying weekly might be performing exceptionally well in a highly regulated industry, or significantly underperforming in a cloud-native startup. Understanding the distribution of performance across the industry—where the top performers cluster, where the median falls, and what constitutes foundational challenges—enables leaders to set realistic improvement targets and identify whether their constraints are technical, organizational, or process-driven.
The research
DORA’s 2025 research surveyed nearly 5,000 technology professionals to establish current benchmarks for software delivery performance metrics. The study collected self-reported data on deployment frequency, lead time for changes, change failure rate, failed deployment recovery time, and rework rate to create a comprehensive picture of the current state of software delivery across industries.
Key Findings:
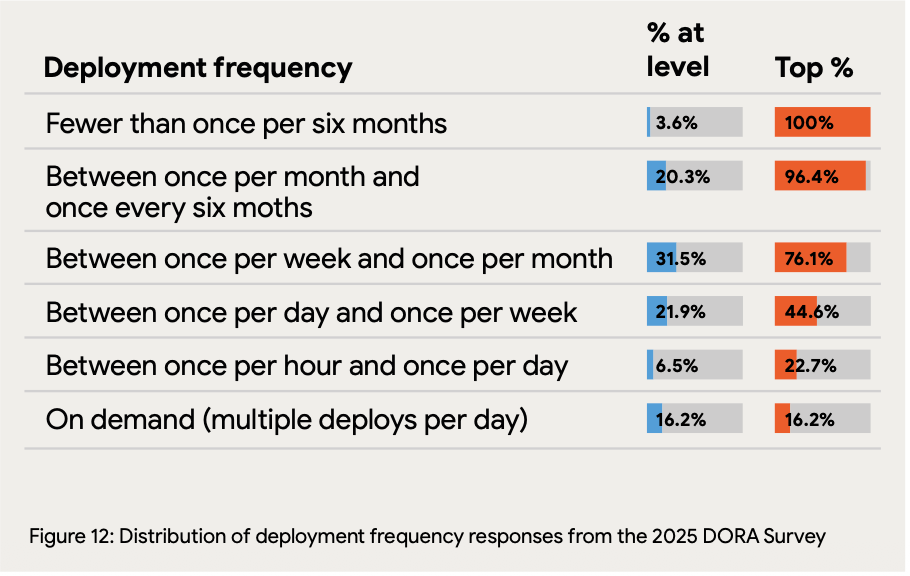
Deployment frequency shows a wide distribution: Only 16.2% of organizations achieve on-demand deployment (multiple times per day), with 21.9% deploying between once per day and once per week. Notably, 23.9% of teams deploy less than once per month, indicating that infrequent deployment remains common despite years of DevOps adoption efforts.

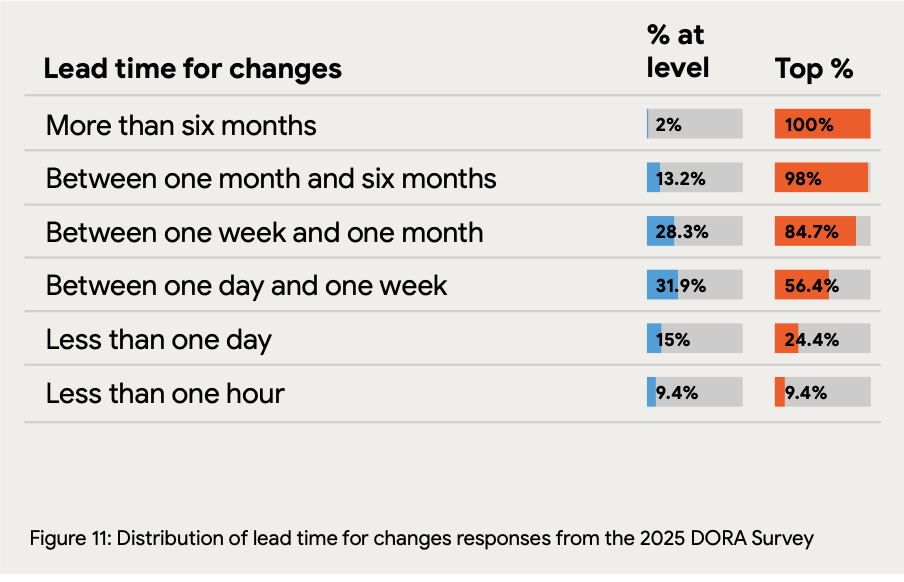
Lead time varies dramatically by maturity level: Just 9.4% of teams achieve lead times under one hour, while 31.9% fall in the one-day-to-one-week range. The concerning finding: 43.5% of teams require more than one week from code commit to production, suggesting significant pipeline inefficiencies or process bottlenecks that compound in the AI era.

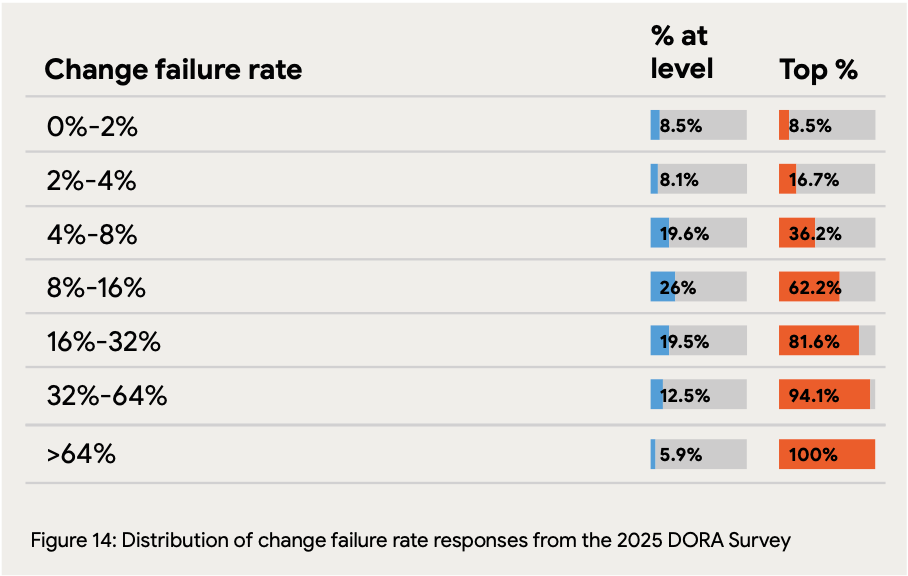
Change failure rates cluster in the middle ranges: The largest group (26%) experiences change failure rates between 8-16%, while only 8.5% achieve the elite benchmark of 0-2% failures. Critically, 39.5% of teams have failure rates above 16%, indicating that quality issues in deployment remain a persistent challenge for a substantial portion of organizations.
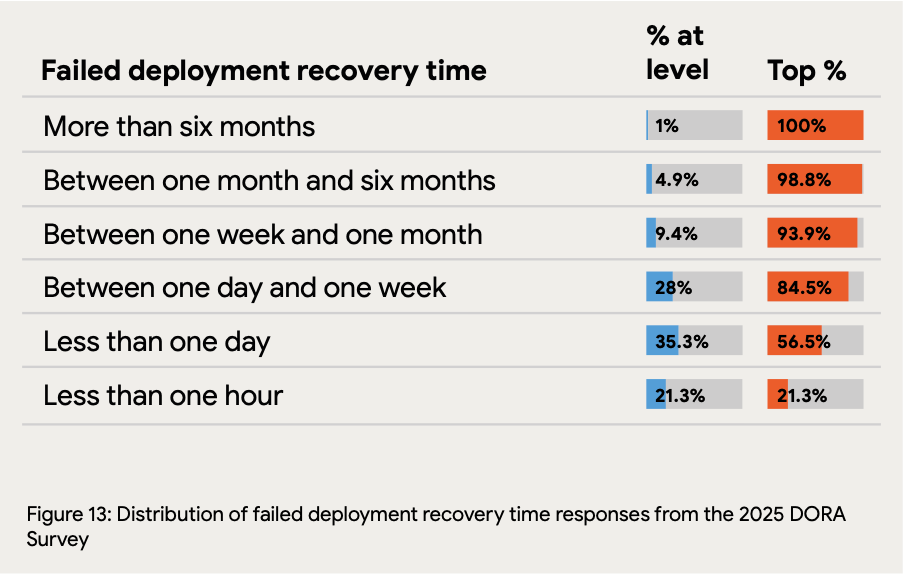
Recovery time reveals incident response maturity: While 21.3% of teams recover from failures in under an hour, 56.5% require between one day and one week for restoration. The 15.3% of teams needing more than a week to recover face compounding business impact from each failure, making stability issues exponentially more costly.
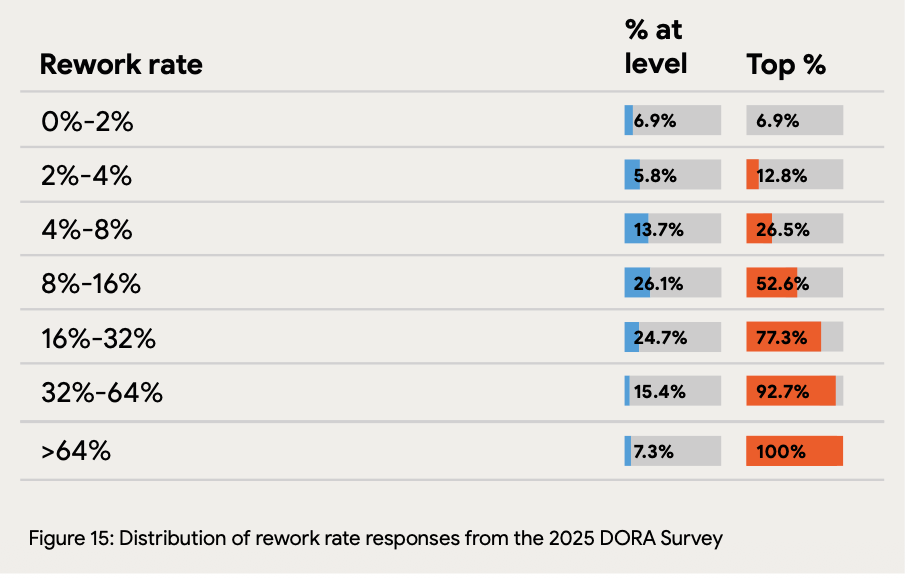
Rework consumes significant capacity across all teams: Only 7.3% of teams report rework rates below 2%, while 26.1% experience rework rates between 8-16%. This means more than a quarter of teams spend substantial deployment capacity addressing bugs rather than delivering new value—a hidden tax on productivity that AI code generation may inadvertently increase.


The application
The 2025 benchmarks reveal a stark reality: while elite performers have achieved impressive delivery stats, the majority of teams still struggle with fundamental throughput and stability challenges. The data shows a multi-modal distribution rather than a smooth curve—teams tend to cluster at either high-maturity or low-maturity levels, with fewer in between.
The research suggests that improvements require systemic changes rather than incremental tweaks. For leaders investing in AI tools, these benchmarks provide critical context: if your team sits in the lower half of any metric, AI may accelerate problems faster than it delivers value.
Engineering leaders can use these benchmarks in a few key ways:
Measure all four metrics, not just velocity: Teams in the top quartile for deployment frequency average significantly lower change failure rates than those deploying monthly. Use the complete picture to identify whether your constraint is speed, stability, or both, especially before investing heavily in AI tools.
Set incremental targets based on your current cluster: If deploying monthly with a 20% failure rate, target weekly deployments at 15% failures first. The distributions show performance follows discrete jumps (monthly → weekly → daily) rather than smooth progressions.
Prioritize recovery time before accelerating deployment: The 56.5% of teams requiring days to recover face multiplicative risk—each deployment discourages future deployments, creating a vicious cycle. Ensure recovery time is under one day before using AI to accelerate code generation.
—
Happy Research Tuesday,
Lizzie
Wow, the bit about raw numbers lacking context realy clicked. It's like judging an exam score without knowing the curriculum, isn't it?